Python 視覺化(1) matplotlib 基本設置:子圖操作
Categories:
子圖
add_subplot
初使用時最常接觸的就是這個方法,當要用某張子圖的時候再使用 fig.add_subplot() 得到某個 ax ,用它進行繪圖。
import matplotlib.pyplot as plt
fig = plt.figure(figsize=(20, 16), dpi=300)
fig.suptitle("Big title", fontsize=20)

# 子圖 1
ax = fig.add_subplot(2, 1, 1)
ax.title.set_text("Subtitle 1")
plt.plot(np.arange(1, 11), color='b', label="lr", alpha=0.7)
ax.legend() # 圖例

# 子圖 2
ax = fig.add_subplot(2, 1, 1)
ax.title.set_text("Subtitle 1")
plt.plot(np.arange(1, 11), color='r', label="lr", alpha=0.7)
ax.legend()

plt.savefig("fileName.png")
但我並不喜歡這個用法,以上面這份程式為例,這總作法會讓 fig.add_subplot(2, 1, 1) 散布在整份程式中,一旦我要修改子圖在行列上的數量,修正起來變得無比麻煩。
一口氣指定完子圖
一種方法是:
fig, axes = plt.subplots(n_rows, n_cols)
不錯的是可以一口氣解決,但我更喜歡另一種作法:
fig = plt.figure(figsize=(10, 8), dpi=100)
axes = fig.subplots(2, 3).reshape(-1) # axes.shape: (6, )
axes = fig.subplots(2, 3)             # axes.shape: (2, 3)
原先的作法在取用 axes 的時候,要謹慎的選取 axes[0][1] 之類的 index ,同樣的一旦子圖在行列上的數量改變,透過 index 取得 ax 的時候也很容易出錯。因此我習慣先把他 reshape 成一個維度,直接用 ax = axes[i] 取用,簡單省事。缺點是難以知道現在處於哪一行哪一列,如果子圖有需要落在確切位置的需求,這個簡單粗暴的方法可能就不太適合。
大標題
ax.set_title("sub plot title") # 子圖的標題
fig.suptitle("Figure title")   # 整張圖的大標題
合併子圖、跨行跨列
subplot2grid
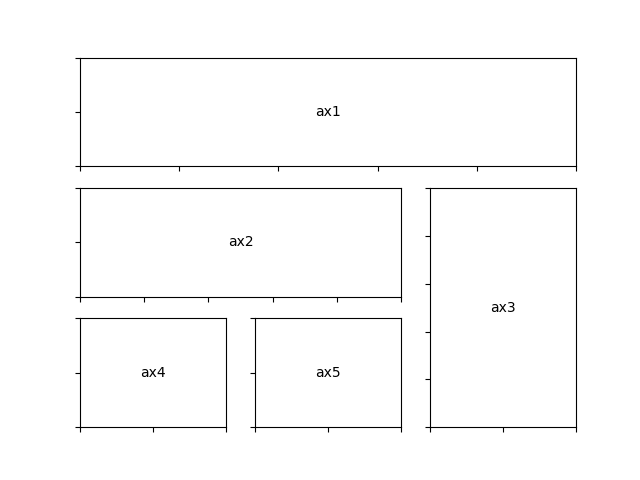
上面的用法都是規規矩矩,每張子圖大小一致。想要讓圖的形狀跨越多欄多列,應該使用 subplot2grid。subplot2grid example
ax1 = plt.subplot2grid((3,3), (0,0), colspan=3)
ax2 = plt.subplot2grid((3,3), (1,0), colspan=2)
ax3 = plt.subplot2grid((3,3), (1, 2), rowspan=2)
ax4 = plt.subplot2grid((3,3), (2, 0))
ax5 = plt.subplot2grid((3,3), (2, 1))
得到的圖相當於:
事實上 subplot2grid 依然可以作到像是 subplot 這樣只給出正規方正的子圖,在不做 colspan/rowspan 的情況下,這兩個操作是等價的:
ax = plt.subplot(2,2,1)  # 1. 算子圖要從 1 開始算子圖
ax = plt.subplot2grid((2,2),(0, 0)) # 2. 先規定整張圖的 (row, col), 在列出要回傳的子圖位於哪個位置 (不像上面是算 index)
GridSpec
還有另一個方法是透過 GridSpec 達成。我們可以先用 gridspec 創建一個框架,並把框架的某一塊指派給 plt.subplot 真正創建子圖。
import matplotlib.gridspec as gridspec
gs = gridspec.GridSpec(2, 2)
ax = plt.subplot(gs[0, 0]) # 等價 ax = plt.subplot2grid((2,2),(0, 0))
所以,在前面一小節的分隔圖,在這個章節應該如下實做:
gs = gridspec.GridSpec(3, 3)
ax1 = plt.subplot(gs[0, :])
ax2 = plt.subplot(gs[1,:-1])
ax3 = plt.subplot(gs[1:, -1])
ax4 = plt.subplot(gs[-1,0])
ax5 = plt.subplot(gs[-1,-2])
subplot2grid 與 GridSpec 的差別
我覺得可這樣看待
subplot2grid屬於 pyplot 類別中,它直接與畫面操作有關,所以直接指派位置就有圖出來了ax = plt.subplot2grid((2,2),(0, 0))但是
gridspec不是屬於 pyplot ,如果只有創建而沒有再指定畫布,是不會出現東西的import matplotlib.gridspec as gridspec gs = gridspec.GridSpec(2, 2) plt.show() # 不會有圖跑出來喔
此外,gridspec 能做到的 layout(布局) 也更加彈性,詳細可以在這篇裡面看: Customizing Location of Subplot Using GridSpec ,中文版: 使用 GridSpec 自定义子图位置。
圖上標示與設置
限制座標軸數值
限制 x 與 y 軸顯示的數值上下界。
ax.set_ylim([0, 0.1])
ax.set_xlim([0, 10])
下圖是來自 Matplotlib 的 Quick Start,快速提及幾個常用的 function 各自歸屬 Figure 還是 Axes。

繪製橫/直線
ax.axhline(y=0.03, color='r', linestyle='-.', alpha=0.2)  # 橫線
ax.axvline(x=5, color='b', linestyle='-*', alpha=0.2)  # 直線
縮減空白邊緣
fig.tight_layout(rect=[0, 0.03, 1, 0.95]) # 保留標題的空間
fig.suptitle("title")
fig.savefig("fig.png")
tight_layout 要在所有繪圖都結束之後,就要 savefig 或是 plt.show() 之前再放才會生效!或是在 import之後直接改變全局:
import matplotlib.pyplot as plt
plt.rcParams["figure.autolayout"] = True
全局的設置 matplotlibrc
matplotlib 裡面有很多設定,包含 dpi, figsize, color, linewidth…..,如果希望一些改變能夠直接作用在 global 上,可以透過設定 matplotlibrc 檔案達成:
在沒有使用 style.use('<path>/<style-name>.mplstyle') 指向設定檔時,預設的搜索順序是這樣:
- 當前資料夾:當前這個資料夾中存在
matplotlibrc,而在這個資料夾之中所有的繪圖,也都想用這樣的設定套用,那非常適合這麼做。 - 如果存在環境變數
$MATPLOTLIBRC:如果這是個檔案,就直接用。如果是個資料夾,會尋找並使用其下的$MATPLOTLIBRC/matplotlibrc - 恩,剩下兩條我覺得太麻煩了,懶得翻譯。可以去看原文。
如果上述的路徑下都沒有 matplotlibrc 檔案那不會再額外搜索其他地方。我們可以直接透過下面這個的作法尋找當前使用的是誰:
import matplotlib
matplotlib.matplotlib_fname()
我的 matplotlibrc 檔案
figure.autolayout: True
legend.fontsize:   large
figure.titlesize:   x-large
figure.dpi:  100
axes.titlesize:     x-large
image.cmap: hsv
hist.bins: 20